In Clustered Data ONTAP 8.x and ONTAP 9 there are multiple log files. If you plan to review logs, the good place to start is EMS log file. The Event Management System (EMS) collects events that are noticed by ONTAP. It also provides filtering mechanism for easy review. EMS events can be viewed from the clustershell – You can review node’s log by executing command
cluster1::> event log show
This command will print all events from the newest ones to the oldest from the current period (last 4000 events). You can also specify a date range or time for the events, for example to print all events from last 10 minutes:
cluster1::> event log show -time >10m
Or if you would like to print all events that happened between 13:00 – and 15:00 (1 PM – 3 PM) 24th of September:
cluster1::> event log show -time "9/24/2017 13:00:00".."9/24/2017 15:00:00"
If, for instance, you would like to review all ERRORS for node1 that happened in last 30 minutes, you can run a command
cluster1::> event log show -severity ERROR -time >30m -node node1
Possible entries for severity fields are:
- emergency
- alter
- critical
- error
- warning
- notice
- informational
- debug
If you would like to view all events or warning or higher severity, you can execute:
cluster1::> event log show -severity <=WARNING
How to review older logs?
Reviewing events by using event log show command is great, however it has one major issue. There is a limited number of events that are checked. The limit might be different for various versions of ONTAP, however from currently it’s around 4000 latest events. ONTAP cluster with many SVMs, a lot of traffic… 4000 event history will only let you review last 48-72 hours. What if you wish to review older logs, for example checked what happened 7 days ago? There are at least two options available:
Access systemshell
You can review audit logs by accessing systemshell, which I explained here: ONTAP 9 – clustershell, nodeshell and systemshell (screencast). I do not recommend reviewing logs this way, since systemshell should not be accessed, unless the specific operation can be executed only from that level, or you are asked by support engineer to do so. However – this is the possibility.
Access SPI by web browser
Much better option would be to access a Service Processor Infrastructure (spi) web service. Starting from Clustered Data ONTAP 8.2.1 spi services are enabled by default. You can access SPI with and html browser at https://cluster-mgmt-ip/spi. If you want to verify what is your cluster-mgmt-ip you can execute:
cluster1::> net int show -role cluster-mgmt
  (network interface show)
            Logical    Status     Network            Current       Current Is
Vserver     Interface  Admin/Oper Address/Mask       Node          Port    Home
----------- ---------- ---------- ------------------ ------------- ------- ----
cluster1
            cluster_mgmt up/up    192.168.0.101/24   node1         a0b     true
Once you have verified cluster-mgmt-ip, you can navigate to (in my case) https://192.168.0.101/spi/ with web browser such as Firefox, or Chrome.

spi authentication
Depending on SSL configuration, your browser might print a security alert. Once action is confirmed, enter username and password for Your ONTAP administrator user. After successful authentication you should be able to see page similar to this one:
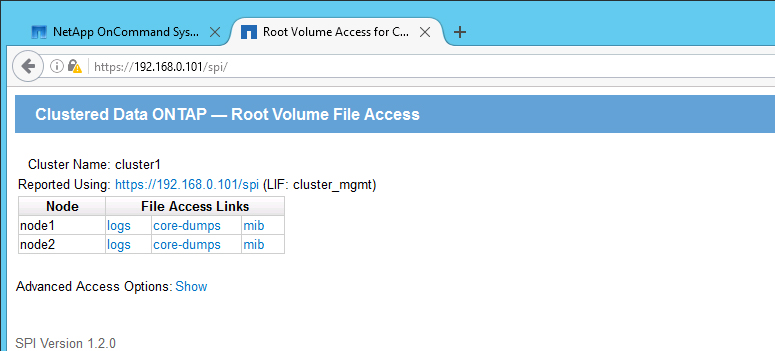
ONTAP9 spi web service
Now, by following the link you can access selected node logs. (Alternatively you can go directly for node’s log location, for example to access node1 logs navigate to https://cluster-mgmt-ip-address/spi/node1/etc/log/). From here you can review audit logs with Your preferred text viewer (I’d advice Notepad++ instead of windows built-in notepad).
In my next entries I will describe in a bit more depth the audit logs.